- Summary
- Table Of Content
- Methodology
Optical Emission Spectroscopy Market Size:
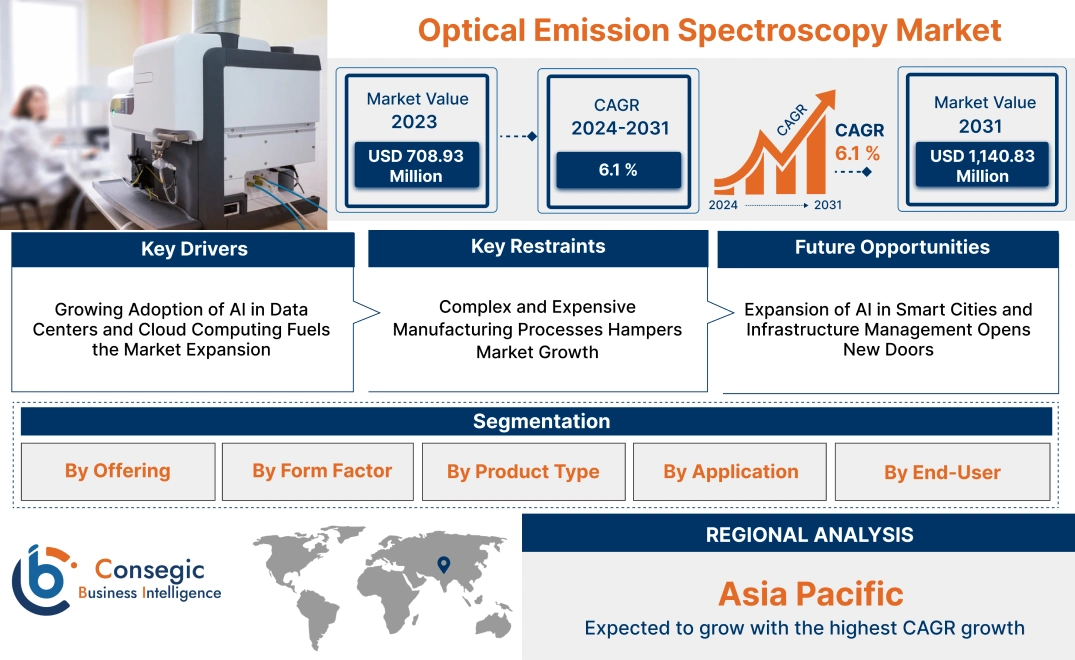
Optical Emission Spectroscopy Market size is estimated to reach over USD 1,140.83 Million by 2031 from a value of USD 708.93 Million in 2023 and is projected to grow by USD 739.74 Million in 2024, growing at a CAGR of 6.1% from 2023 to 2031.
Optical Emission Spectroscopy Market Scope & Overview:
Optical emission spectroscopy (OES) is a technique widely utilized in devices to determine the elemental composition of various metals by using arc and spark excitation methods. The method involves a trace metal analysis technique to determine the chemical composition of metallic samples. Moreover, the key factor driving the application in oil and gas, metals and heavy machinery, automotive and scrap, and recycling among others is the rapid analysis time and inherent accuracy. Additionally, the benefits include high accuracy, fast analysis, versatility, cost-effectiveness, and others. Further, the feature includes high-resolution optics, multi-channel detection, and improved software algorithms for data analysis among others.
Optical Emission Spectroscopy Market Dynamics - (DRO) :
Key Drivers:
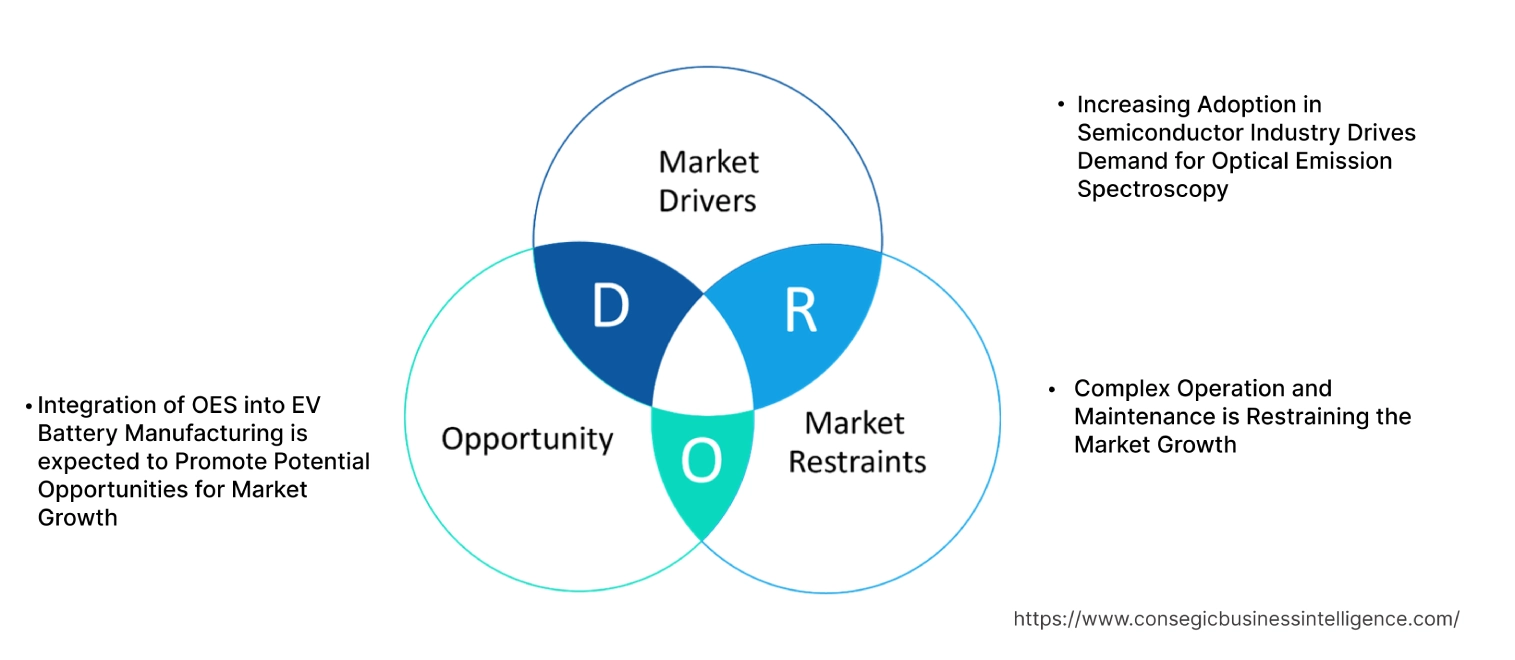
Increasing Adoption in Semiconductor Industry Drives Demand for Optical Emission Spectroscopy
The spectroscopy technique plays a crucial role in the quality control inspections and wafer probing analysis for finished semiconductor wafers. The spectroscopy has specific features that suit best for the semiconductor application including high resolution, high-speed measurement capability, ability to support thin film measurement applications, and others. Moreover, the miniaturization of various semiconductor devices is propelling the optical emission spectroscopy market due to the ability to control very small dimensions during the etching process.
- In August 2021, HORIBA Scientific partnered with Covalent Metrology to launch the first demonstration lab in North America to accelerate research and development work in the semiconductor, electronics, and advanced materials industries.
Thus, the progress of the semiconductor industry and the increasing miniaturization of semiconductor devices are driving the optical emission spectroscopy market growth.
Key Restraints :
Complex Operation and Maintenance is Restraining the Market Growth
OES requires professionals with the knowledge and skills to effectively utilize building equipment for metal analysis. Additionally, the device requires periodic maintenance and well-trained operators have the ability to identify signs that lead to unplanned service repairs which consume a huge amount of cost. Moreover, the cost of training and deployment of spectroscopy is costly, which hampers the market. Further, in the fast-moving metal-producing industries, utilize spectroscopy technique for maintaining the quality of the product which in turn requires a skilled operator to optimize the complex processes to ensure product consistency and regulatory compliance. .
Thus, the high operating cost and need for skilled operators as well as the cost associated with periodic maintenance is hampering the market.
Future Opportunities :
Integration of OES into EV Battery Manufacturing is expected to Promote Potential Opportunities for Market Growth.
The rising adoption of electric vehicles is propelling the demand for EV batteries which require optical emission spectroscopy in the recycling of battery metals to achieve sustainability goals and stringent government regulation to fight climate change. Further, the integration of advanced spectroscopy into the production process significantly reduces the impurities in battery metals which reduces the overall time for analysis.
- In January 2023, Sensmet launched an online monitoring technology to improve the manufacturing and recycling of battery metals. The improvement involves the integration of ICP next to the production process to generate real-time metal concentration results by fully automating online measurement for quality control.
Hence, the rising adoption of electric vehicles is anticipated to propel the optical emission spectroscopy market opportunities during the forecast period.
Optical Emission Spectroscopy Market Segmental Analysis :
By Offering:
Based on the offering, the market is segmented into equipment and service.
Trends in the offering
- The trend towards rising need for high-quality spectroscopy equipment in the pharmaceutical and medical sectors is boosting the market.
- The technological advancement in spectroscopy instruments is driving the need for services segment for restoring the latest version in the existing spectroscopy.
The equipment accounted for the largest revenue share in the year 2023.
- The equipment segment plays a crucial role by capturing light and then separating it into spectral lines as well as measuring it simultaneously. They use high-resolution grating to separate the incoming light into element-specific wavelengths.
- The advantages include reduced analysis time, wide elemental coverage, less detection limit, and high matrix tolerance among others driving the optical emission spectroscopy market.
- In November 2023, SPECTRO Analytical Instruments launched upgraded SPECTRO GENESIS ICP-OES featuring high-performance, high-value, with major advancements to provide greater sensitivity, compact design, improved ergonomics, and critical state-of-the-art technologies. Additionally, GENESIS is a cost-efficient elemental analysis solution for emission and process control applications.
- Thus, the aforementioned advantages of the equipment segment play a crucial role in driving the optical emission spectroscopy market expansion.
The service is anticipated to register the fastest CAGR growth during the forecast period.
- The services segment of the optical emission spectroscopy market is further segmented into installation service and maintenance service which is deployed by the companies.
- The rising need for quantitatively determining the composition of solid metal components is driving the optical emission spectroscopy market which in turn requires periodic maintenance and other services as per the requirement.
- In September 2023, SGS Société Générale de Surveillance SA expanded its services offering with the addition of a lithium examination hub in Kalgoorlie, Australia with plasma mass spectrometry and inductively coupled plasma optical emission spectroscopy.
- Therefore, the rising utilization of spectroscopy is driving the need for periodic maintenance, and other services are anticipated to boost the progress of the market during the forecast period.
By Form Factor:
Based on the form factor, the market is bifurcated into Stationary OES and Mobile OES.
Trends in the form factor :
- The trend towards real-time remote monitoring and controlled analysis is driving the need for mobile OES.
- The integration of stationary OES instruments in the production process for quality control is boosting the need for stationary OES.
The stationary OES accounted for the largest revenue share in the year 2023.
- The stationary OES plays a crucial role in providing investigation with high performance and precision which makes it ideal for complex and detailed analysis. Additionally, metals, mining, and materials science, which require rigorous testing and quality control depend on stationary OES for providing accurate and reliable results.
- Moreover, the stationary OES has advanced features enhancing the analytical power which is preferable for laboratory and industrial applications driving the progress of the stationary OES segment.
- In January 2022, SPECTRO Analytical Instruments launched SPECTRO ARCOS which is a stationary OES for metals, chemicals, petrochemicals, and more. The device features a portable video camera for remote monitoring.
- Thus, advanced features that enhance the analytical power in metals, mining, and materials science among other industries are driving the optical emission spectroscopy market trend.
The mobile OES is anticipated to register the fastest CAGR growth during the forecast period.
- The rising need for compact and mobile OES instruments in various industries is driving the mobile OES segment. Moreover, the portability combined with high performance is making mobile OES preferable in various industries including the metal and mining industry among others.
- Additionally, the advantages of adopting mobile OES include ease of use, on-site analysis capabilities, and reduced sample preparation requirements, making them suitable for remote and field applications.
- For Instance, Hitachi High-Tech has two categories of mobile OES including PMI-MASTER Smart and PMI-MASTER Pro2 which are ideal for analyzing steels and other alloying materials including aluminum, nickel and others as well as conducting material verification and quality control among others.
- Therefore, the aforementioned advantages and rising need for compact and portable options are anticipated to boost the evolution of the market during the forecast period.
By Product Type:
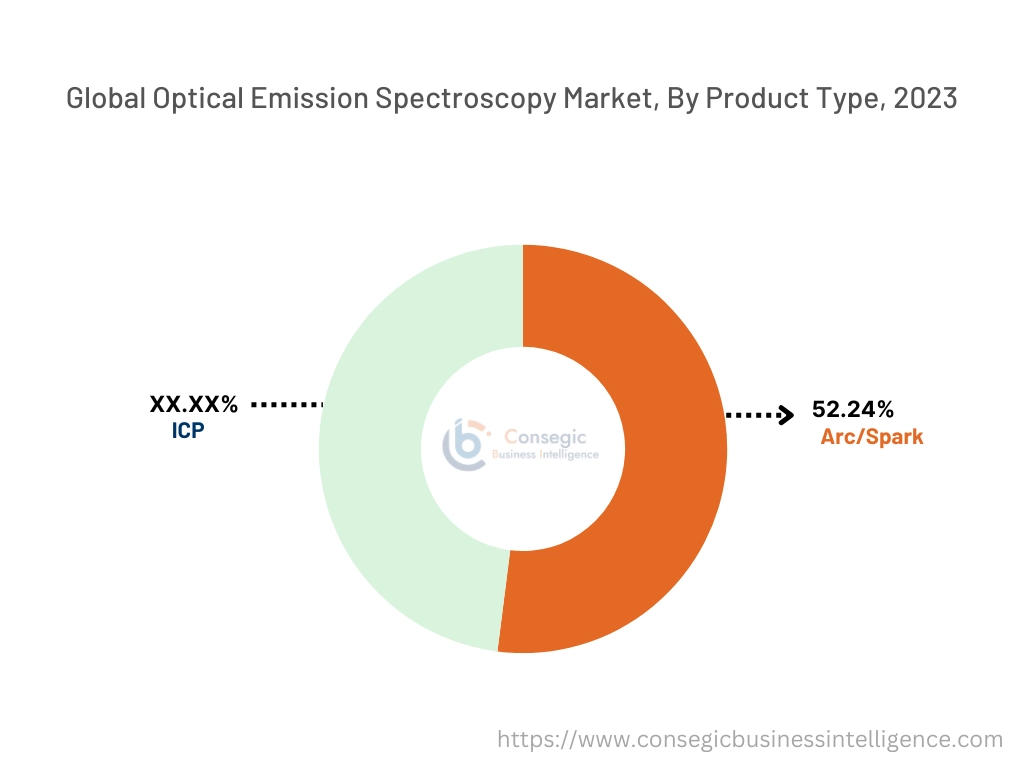
Based on the product type, the market is bifurcated into Arc/Spark and ICP (Inductively Coupled Plasma).
Trends in the product type:
- The trend towards high sensitivity and multi-element detection capabilities is driving the need for ICP.
- The rising trend towards portable Arc/Spark is spurring the market development for on-spot analysis.
The Arc/Spark accounted for the largest revenue share of 52.24% in the year 2023.
- The Arc/Spark plays a crucial role in the optical emission spectroscopy market by providing high accuracy, sensitivity, and reliability in analyzing metallic samples.
- Additionally, various materials including metals, alloys, and materials used in industries such as manufacturing, automotive, aerospace, and research laboratories require Arc/Spark for precise elemental analysis.
- Moreover, the technological advancements in Arc/Spark with enhanced features including improved detection limits, and faster analysis times for quality control and material verification are driving the need for the Arc/Spark segment.
- In June 2022, SPECTRO Analytical Instruments launched SPECTROMAXx LMX10 ARC/SPARK OES ideal for metal-producing and fabricating plants, and iron and non-ferrous foundries with features including fast, accurate, advanced elemental analysis.
- Thus, the technological advancement in Arc/Spark is driving the segment progress which in turn drives the optical emission spectroscopy market.
The ICP (Inductively Coupled Plasma) is anticipated to register the fastest CAGR growth during the forecast period.
- The features of inductively coupled plasma include high sensitivity, multi-element analysis capabilities, and low detection limits which are crucial for detecting trace elements in soil and water samples as well as ensuring compliance with regulatory standards propelling the need for inductively coupled plasma segments.
- Moreover, the advantages of inductively coupled plasma include simultaneous detection, easy identify the types and ratios of elements, superior sensitivity, and broader elemental coverage among others.
- For instance, Thermo Fisher Scientific Inc. has iCAP PRO Series ICP-OES systems ideal for laboratories with low sample throughput requirements and advanced features including an iFR analysis mode and an eUV analysis mode.
- Therefore, the instrument’s ability to adhere to regulatory compliance and advanced technologies embedded in instruments is anticipated to boost the development of the market during the forecast period.
By Application:
Based on the application, the market is segmented into environmental analysis, chemical analysis, pharmaceutical & cosmetic analysis, mining element analysis, material analysis, nuclear energy analysis, and others.
Trends in the application:
- The spectroscopy technique helps in analyzing metal alloys used in pharmaceutical & cosmetic analysis such as surgical instruments and implants.
- Spectroscopy is used for trace metals and pollutants in monitoring air, water, and soil due to stringent rules and regulations.
The chemical analysis accounted for the largest revenue share in the year 2023.
- The optical emission spectroscopy is majorly used for chemical analysis due to the rapid elemental analysis in materials testing and quality control processes is boosting the demand for chemical analysis application.
- Moreover, spectroscopy technique has the ability to provide precise quantitative analysis which makes it a preferable choice in the chemical analysis segment.
- For instance, Spectro and Hitachi among others are some of the optical emission spectroscopy brands used in metal manufacturing, including trace analysis of carbon, phosphorous, sulfur, and nitrogen among others.
- Thus, the rapid elemental analysis in materials testing and quality control processes is driving the need for optical emission spectroscopy market expansion.
The material analysis is anticipated to register the fastest CAGR growth during the forecast period.
- The spectroscopy technique is used for material analysis to provide rapid and accurate elemental analysis of various materials which makes it a valuable tool for ensuring product quality and compliance with manufacturing standards.
- Moreover, manufacturers in the automotive and aerospace sectors use instruments for verifying the integrity of materials as well as adhering to stringent rules and regulations among others propelling the evolution of the segment.
- For instance, in November 2023, Thermo Fisher Scientific Inc. launched the Thermo Scientific ARL iSpark Plus OES The series is ideal for metal production, processing, and recycling sectors and others.
- Therefore, the rising need for material analysis in the automotive and aerospace sectors for verifying the integrity of materials as well as adhering to stringent rules is anticipated to boost the growth of the market during the forecast period.
By End-Use:
Based on the product type, the market is bifurcated into oil and gas, metal manufacturing, automotive, scrap and recycling, aerospace and defense, chemicals, infrastructure, pharmaceuticals and life sciences, power generation, food and beverages, environmental, and others.
Trends in the product type
- The rising need for lightweight and durable materials in the aerospace and defense sector coupled with the need for rigorous quality control measures, is driving the market adoption.
- The food and beverages sector faces stringent rules and regulations as well as verifying the composition of various raw ingredients and finished goods is boosting the optical emission spectroscopy market demand.
Metal manufacturing accounted for the largest revenue share of 18.12% in the year 2023.
- Metal manufacturers widely utilize spectroscopy techniques for analyzing the composition of metals and alloys as well as accurately determining the fundamental composition of various metals or alloys.
- The primary role of the spectroscopy technique in metal manufacturing is to verify the chemical composition of metals, steel, and alloys among others which enables businesses to maintain the desired properties and performance features.
- In September 2021, Bruker launched Q4 POLO which is a compact optical emission spectroscopy featuring higher analytical performance for various applications in metal manufacturing.
- Thus, the ability to analyze metal quickly with precision and high-performance features is driving the demand for the market in metal manufacturing.
The automotive sector is anticipated to register the fastest CAGR growth during the forecast period.
- The optical emission spectroscopy is employed in the automotive sector to provide a perfect solution for the inspection of metal parts driving the need for spectroscopy techniques.
- The primary role of instruments in EV batteries for the automotive sector is to provide ultra-fast elemental depth profiling of thin and thick films which is spurring the market development.
- Moreover, spectroscopy helps ensure quality control, optimize efficiency, and address environmental concerns in the automotive sector.
- For instance, according to IBEF, the total number of EV vehicles sold in FY24 till January 2024 reached 1.32 million which has achieved a significant milestone in the automotive sector. Hence, the increasing number of EV vehicles is propelling the need for spectroscopy techniques for film analysis of batteries used in EV vehicles in India.
- Therefore, the ability to ensure quality control, optimizing efficiency, and growing demand for EV vehicles is anticipated to boost the growth of the market during the forecast period.
Regional Analysis:
The regions covered are North America, Europe, Asia Pacific, the Middle East and Africa, and Latin America.
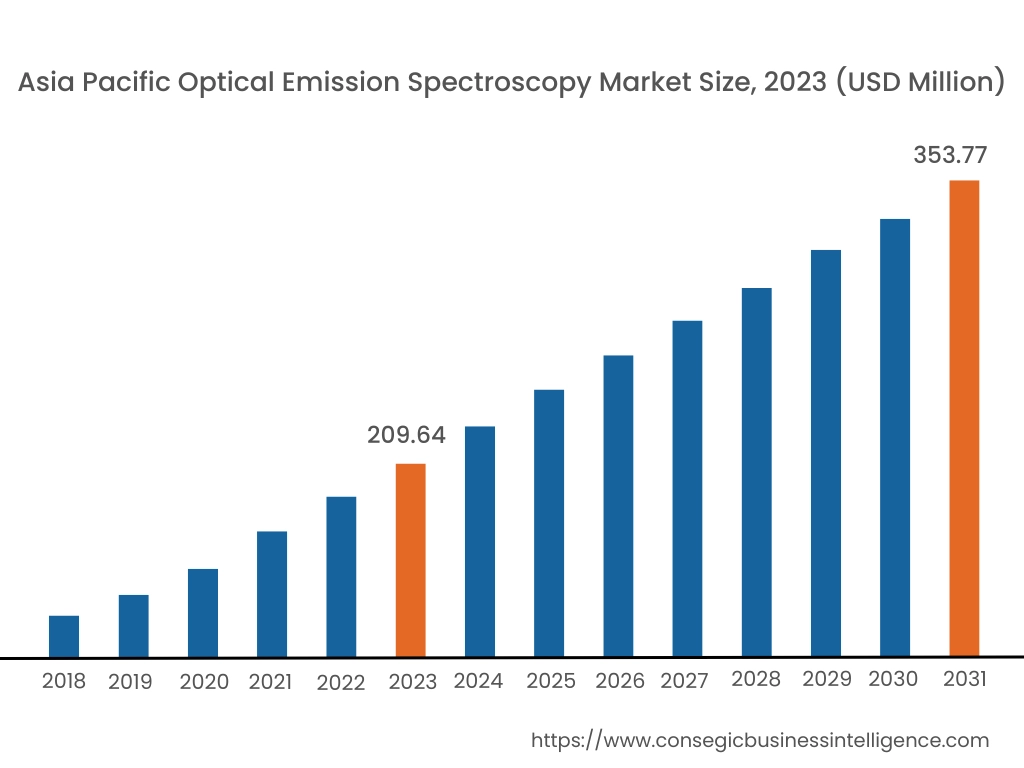
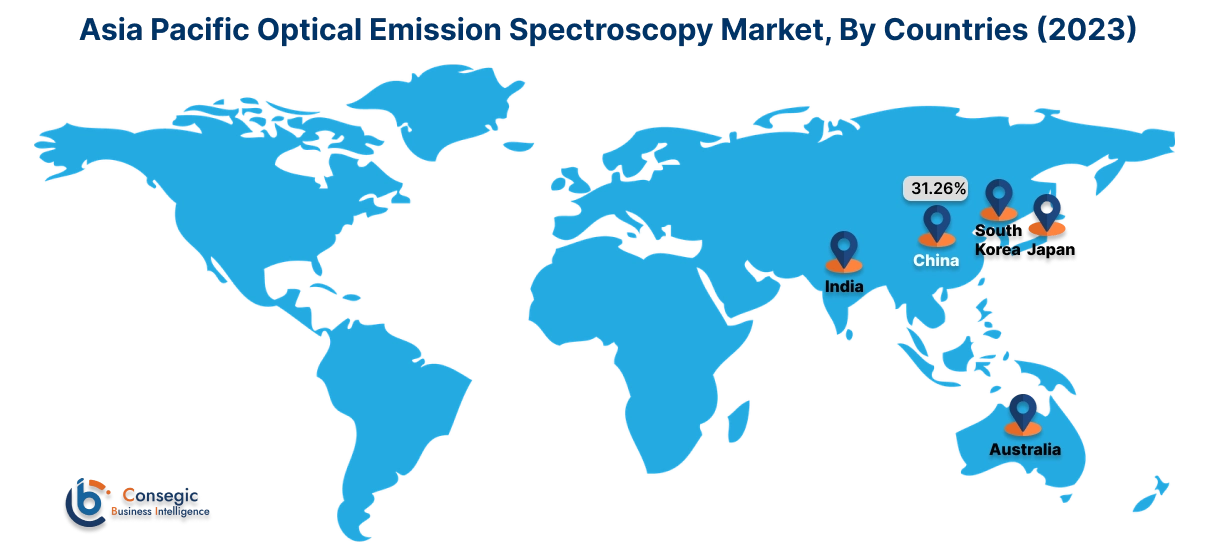
Asia Pacific region was valued at USD 209.64 Million in 2023. Moreover, it is projected to grow by USD 219.63 Million in 2024 and reach over USD 353.77 Million by 2031. Out of this, China accounted for the maximum revenue share of 31.26%. As per the optical emission spectroscopy market analysis, due to rapid industrialization and urbanization in countries including China, Japan, and India are driving the evolution of spectroscopy techniques. The increasing need for advanced analytical technologies for metal processing and food safety among others is propelling the progress of the global optical emission spectroscopy market size in the Asia Pacific region.
- In January 2024, Shimadzu launched ICPMS-2040/2050 Series. The spectrometer features a Mini-Torch System to generate plasma, a new mechanism for removing unnecessary ions and minimizing operator intervention among others.
North America is estimated to reach over USD 352.74 Million by 2031 from a value of USD 218.49 Million in 2023 and is projected to grow by USD 228.04 Million in 2024. The evolution is driven by the government promoting the adoption of advanced analytical tools. Technological advancement and the increasing need for quality control and process optimization are propelling the development in North American region.
- In April 2024, Thermo Fisher based out in U.S launched Qtegra Intelligent Scientific Data Solution (ISDS) Software for leveraging artificial intelligence (AI) technology and neural networks in to iCAP PRO Series ICP.
The regional analysis depicts that the increasing focus towards technological innovation and sustainability in Europe is increase the adoption of spectroscopy technique driving the market expansion. The primary factor driving the market in the Middle East and African region is evolution of manufacturing and research activities as well as ability to provide accurate and real-time information about the elemental composition of materials. Further, the advancement in renewable energy sector is paving the way for the need of optical emission spectroscopy market in Latin America region.
Top Key Players & Market Share Insights:
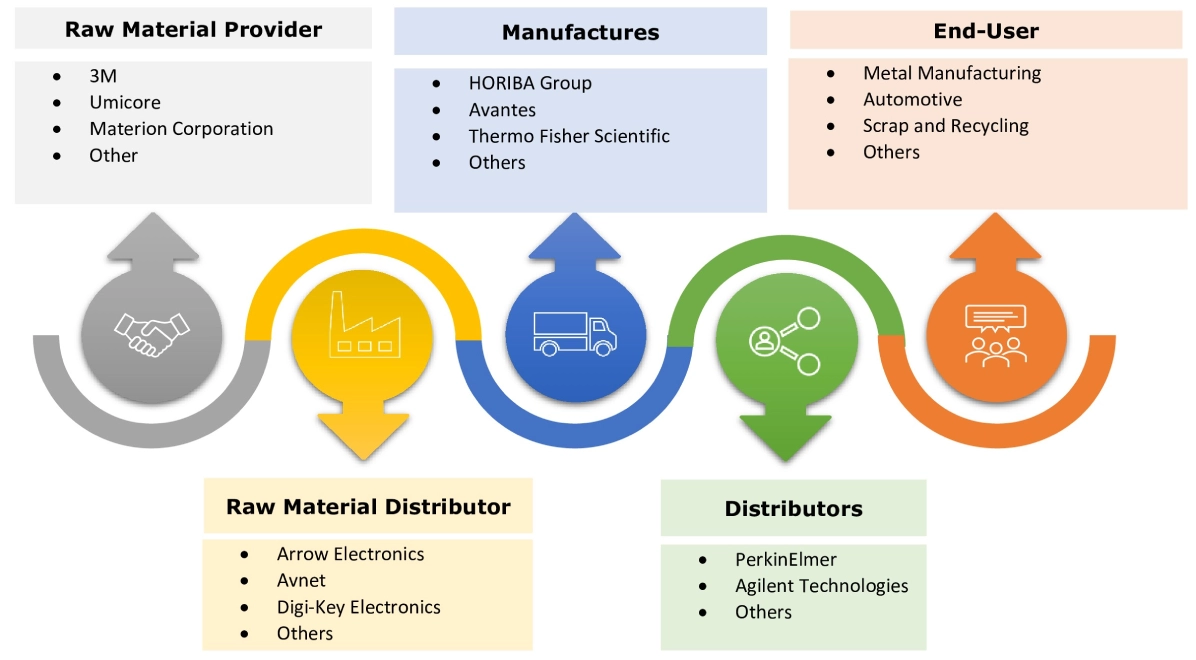
The optical emission spectroscopy market is highly competitive with major players providing Spectroscopy to the national and international markets. Key players are adopting several strategies in research and development (R&D), product innovation, and end-user launches to hold a strong position in the spectroscopy market. Key players in the optical emission spectroscopy industry include-
-
- Hitachi High-Tech Analytical Science (UK)
- Bruker (Germany)
- SPECTRO Analytical Instruments GmbH. (Germany)
- JEOL Ltd. (Japan)
- PerkinElmer (U.S)
- Shimadzu Corporation (Japan)
- HORIBA Group (Japan)
- Avantes (U.S)
- Thermo Fisher Scientific (U.S)
- Agilent Technologies (U.S)
Recent Industry Developments :
Product launches:
- In June 2024, Bruker launched Q6 NEWTON benchtop spark OES. The instrument is designed to improve alloy composition analysis in metals manufacturing. The innovation in instrument has enhanced precision, speed, and reliability.
Mergers & Acquisitions:
- In October 2024, Bruker BioSpin Group acquired electron paramagnetic resonance (EPR) business of Bridge12. The aim of the acquisition is to integrate bridge12 EPR technology into Bruker spectroscopy offerings.
Optical Emission Spectroscopy Market Report Insights :
| Report Attributes | Report Details |
| Study Timeline | 2018-2031 |
| Market Size in 2031 | USD 1,140.83 Million |
| CAGR (2024-2031) | 6.1 % |
| By Offering |
|
| By Form Factor |
|
| By Product Type |
|
| By Application |
|
| By End-User |
|
| By Region |
|
| Key Players |
|
| North America | U.S. Canada Mexico |
| Europe | U.K. Germany France Spain Italy Russia Benelux Rest of Europe |
| APAC | China South Korea Japan India Australia ASEAN Rest of Asia-Pacific |
| Middle East and Africa | GCC Turkey South Africa Rest of MEA |
| LATAM | Brazil Argentina Chile Rest of LATAM |
| Report Coverage |
|
Key Questions Answered in the Report
How big is the optical emission spectroscopy market? +
The Optical Emission Spectroscopy Market size is estimated to reach over USD 1,140.83 Million by 2031 from a value of USD 708.93 Million in 2023 and is projected to grow by USD 739.74 Million in 2024, growing at a CAGR of 6.1% from 2023 to 2031.
What specific segmentation details are covered in the optical emission spectroscopy report? +
The optical emission spectroscopy report includes specific segmentation details for offering, form factor, product type, application, end use and regions.
Which is the fastest segment anticipated to impact the market growth? +
In the optical emission spectroscopy market, the mobile OES segment is the fastest-growing segment during the forecast period due to rising demand for compact and high performance analytical tool is driving the mobile OES segment in the optical emission spectroscopy market.
Who are the major players in the optical emission spectroscopy market? +
The key participants in the optical emission spectroscopy market are Hitachi High-Tech Analytical Science (UK), Bruker (Germany), Shimadzu Corporation (Japan), HORIBA Group (Japan), Avantes (U.S), Thermo Fisher Scientific (U.S), Agilent Technologies (U.S), SPECTRO Analytical Instruments GmbH. (Germany), JEOL Ltd. (Japan), PerkinElmer (U.S) and others.
What are the key trends in the optical emission spectroscopy Market? +
The optical emission spectroscopy market is being shaped by several key trends including the integration of OES into production process for real time monitoring and control over the quality of metal, increasing rule and regulations in food and beverages industry, rising demand for portable and compact analytical tool for determining the elemental composition of various metals are the key trends driving the market.
